Basic SHRED Tutorial on Sea Surface Temperature#
Import Libraries#
# PYSHRED
import pyshred
from pyshred import DataManager, SHRED, SHREDEngine

# Other helper libraries
import matplotlib.pyplot as plt
from scipy.io import loadmat
import torch
import numpy as np
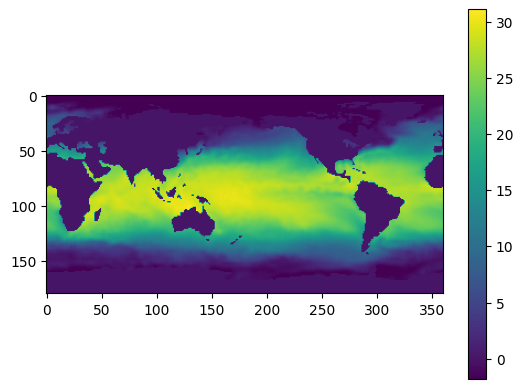
Load in SST Data#
sst_data = np.load("sst_data.npy")
# Plotting a single frame
plt.figure()
plt.imshow(sst_data[0])
plt.colorbar()
plt.show()
Device Info#
device = pyshred.set_device("auto")
# device = pyshred.set_device("cpu") # force CPU
# device = pyshred.set_device("cuda") # force CUDA
# device = pyshred.set_device("mps") # force MPS
# device = pyshred.set_device("cuda", device_id=0) # force specific GPU
pyshred.device_info()
=== PyShred Device Information ===
Current device: cpu
Device config: DeviceConfig(device_type=<DeviceType.AUTO: 'auto'>, device_id=None, force_cpu=False, warn_on_fallback=True)

Device Availability:
  CUDA available: False
  MPS available: False
  CPU: Always available
Initialize Data Manager#
manager = DataManager(
    lags = 52,
    train_size = 0.8,
    val_size = 0.1,
    test_size = 0.1,
)
Add datasets and sensors#
manager.add_data(
    data = "sst_data.npy",
    id = "SST",
    random = 3,
    # mobile=,
    # stationary=,
    # measurements=,
    compress=False,
    seed = 0, # fix the random sensor locations, for reproducible results
)
Analyze sensor summary#
manager.sensor_summary_df
| data id | sensor_number | type | loc/traj | |
|---|---|---|---|---|
| 0 | SST | 0 | stationary (random) | (71, 109) |
| 1 | SST | 1 | stationary (random) | (74, 178) |
| 2 | SST | 2 | stationary (random) | (94, 289) |
manager.sensor_measurements_df
| SST-0 | SST-1 | SST-2 | |
|---|---|---|---|
| 0 | 23.659999 | 27.459999 | 0.0 |
| 1 | 23.259999 | 26.889999 | 0.0 |
| 2 | 23.199999 | 26.849999 | 0.0 |
| 3 | 22.829999 | 26.619999 | 0.0 |
| 4 | 22.539999 | 26.679999 | 0.0 |
| ... | ... | ... | ... |
| 1395 | 28.929999 | 29.249999 | 0.0 |
| 1396 | 28.849999 | 28.919999 | 0.0 |
| 1397 | 28.989999 | 28.889999 | 0.0 |
| 1398 | 28.049999 | 28.699999 | 0.0 |
| 1399 | 28.459999 | 28.589999 | 0.0 |
1400 rows × 3 columns
Get train, validation, and test set#
train_dataset, val_dataset, test_dataset= manager.prepare()
Initialize SHRED#
torch.manual_seed(0) # fix the weight initialization, for reproducible results
shred = SHRED(sequence_model="LSTM", decoder_model="MLP", latent_forecaster="LSTM_Forecaster")
Fit SHRED#
val_errors = shred.fit(train_dataset=train_dataset, val_dataset=val_dataset, num_epochs=10, sindy_regularization=0)
print('val_errors:', val_errors)
Fitting SHRED...
Epoch 1: Average training loss = 0.078330
Validation MSE (epoch 1): 0.037093
Epoch 2: Average training loss = 0.036325
Validation MSE (epoch 2): 0.034117
Epoch 3: Average training loss = 0.033967
Validation MSE (epoch 3): 0.034335
Epoch 4: Average training loss = 0.033617
Validation MSE (epoch 4): 0.034011
Epoch 5: Average training loss = 0.033234
Validation MSE (epoch 5): 0.033349
Epoch 6: Average training loss = 0.031395
Validation MSE (epoch 6): 0.027927
Epoch 7: Average training loss = 0.018353
Validation MSE (epoch 7): 0.014860
Epoch 8: Average training loss = 0.012866
Validation MSE (epoch 8): 0.012220
Epoch 9: Average training loss = 0.011531
Validation MSE (epoch 9): 0.011749
Epoch 10: Average training loss = 0.011430
Validation MSE (epoch 10): 0.011924
val_errors: [0.03709267 0.03411689 0.03433465 0.03401148 0.03334907 0.02792729
 0.01485961 0.01222015 0.01174884 0.01192393]
Evaluate SHRED#
train_mse = shred.evaluate(dataset=train_dataset)
val_mse = shred.evaluate(dataset=val_dataset)
test_mse = shred.evaluate(dataset=test_dataset)
print(f"Train MSE: {train_mse:.3f}")
print(f"Val   MSE: {val_mse:.3f}")
print(f"Test  MSE: {test_mse:.3f}")
Train MSE: 0.010
Val   MSE: 0.012
Test  MSE: 0.014
Initialize SHRED Engine for Downstream Tasks#
engine = SHREDEngine(manager, shred)
Sensor Measurements to Latent Space#
test_latent_from_sensors = engine.sensor_to_latent(manager.test_sensor_measurements)
Forecast Latent Space (No Sensor Measurements)#
val_latents = engine.sensor_to_latent(manager.val_sensor_measurements)
init_latents = val_latents[-shred.latent_forecaster.seed_length:] # seed forecaster with final lag timesteps of latent space from val
h = len(manager.test_sensor_measurements)
test_latent_from_forecaster = engine.forecast_latent(h=h, init_latents=init_latents)
Decode Latent Space to Full-State Space#
test_prediction = engine.decode(test_latent_from_sensors) # latent space generated from sensor data
test_forecast = engine.decode(test_latent_from_forecaster) # latent space generated from latent forecasted (no sensor data)
Compare final frame in prediction and forecast to ground truth:
truth      = sst_data[-1]
prediction = test_prediction['SST'][-1]
forecast   = test_forecast['SST'][-1]

data   = [truth, prediction, forecast]
titles = ["Test Truth Ground Truth", "Test Prediction", "Test Forecast"]

vmin, vmax = np.min([d.min() for d in data]), np.max([d.max() for d in data])

fig, axes = plt.subplots(1, 3, figsize=(20, 4), constrained_layout=True)

for ax, d, title in zip(axes, data, titles):
    im = ax.imshow(d, vmin=vmin, vmax=vmax)
    ax.set(title=title)
    ax.axis("off")

fig.colorbar(im, ax=axes, label="Value", shrink=0.8)
<matplotlib.colorbar.Colorbar at 0x20accb6d3a0>

Evaluate MSE on Ground Truth Data#
# Train
t_train = len(manager.train_sensor_measurements)
train_Y = {'SST': sst_data[0:t_train]}
train_error = engine.evaluate(manager.train_sensor_measurements, train_Y)

# Val
t_val = len(manager.val_sensor_measurements)
val_Y = {'SST': sst_data[t_train:t_train+t_val]}
val_error = engine.evaluate(manager.val_sensor_measurements, val_Y)

# Test
t_test = len(manager.test_sensor_measurements)
test_Y = {'SST': sst_data[-t_test:]}
test_error = engine.evaluate(manager.test_sensor_measurements, test_Y)

print('---------- TRAIN ----------')
print(train_error)
print('\n---------- VAL   ----------')
print(val_error)
print('\n---------- TEST  ----------')
print(test_error)
---------- TRAIN ----------
              MSE      RMSE      MAE        R2
dataset
SST      0.543765  0.737404  0.41998  0.406113

---------- VAL   ----------
              MSE     RMSE       MAE        R2
dataset
SST      0.908324  0.95306  0.496027 -0.398883

---------- TEST  ----------
              MSE      RMSE       MAE        R2
dataset
SST      0.780126  0.883248  0.507533 -0.444451