SINDy-SHRED Tutorial on Sea Surface Temperature#
Import Libraries#
# PYSHRED
from pyshred import DataManager, SHRED, SHREDEngine, SINDy_Forecaster

# Other helper libraries
import matplotlib.pyplot as plt
from scipy.io import loadmat
import torch
import numpy as np
Load in SST Data#
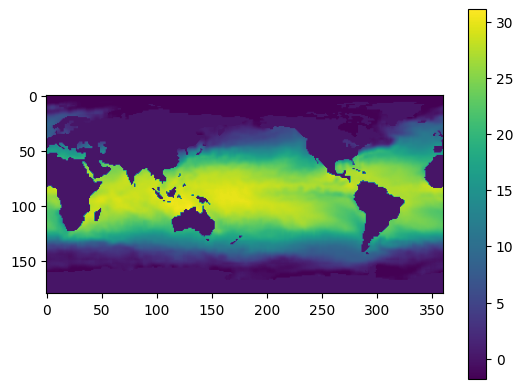
sst_data = np.load("sst_data.npy")
# Plotting a single frame
plt.figure()
plt.imshow(sst_data[0])
plt.colorbar()
plt.show()
Initialize Data Manager#
manager = DataManager(
    lags = 52,
    train_size = 0.8,
    val_size = 0.1,
    test_size = 0.1,
)
Add datasets and sensors#
manager.add_data(
    data = sst_data,
    id = "SST",
    random = 50,
    # mobile=,
    # stationary=,
    # measurements=,
    compress=False,
)
Analyze sensor summary#
manager.sensor_summary_df
| data id | sensor_number | type | loc/traj | |
|---|---|---|---|---|
| 0 | SST | 0 | stationary (random) | (151, 324) |
| 1 | SST | 1 | stationary (random) | (12, 332) |
| 2 | SST | 2 | stationary (random) | (158, 117) |
| 3 | SST | 3 | stationary (random) | (105, 38) |
| 4 | SST | 4 | stationary (random) | (131, 134) |
| 5 | SST | 5 | stationary (random) | (147, 44) |
| 6 | SST | 6 | stationary (random) | (155, 176) |
| 7 | SST | 7 | stationary (random) | (88, 208) |
| 8 | SST | 8 | stationary (random) | (142, 176) |
| 9 | SST | 9 | stationary (random) | (134, 105) |
| 10 | SST | 10 | stationary (random) | (154, 19) |
| 11 | SST | 11 | stationary (random) | (174, 107) |
| 12 | SST | 12 | stationary (random) | (47, 194) |
| 13 | SST | 13 | stationary (random) | (46, 96) |
| 14 | SST | 14 | stationary (random) | (128, 247) |
| 15 | SST | 15 | stationary (random) | (142, 219) |
| 16 | SST | 16 | stationary (random) | (152, 158) |
| 17 | SST | 17 | stationary (random) | (132, 104) |
| 18 | SST | 18 | stationary (random) | (154, 233) |
| 19 | SST | 19 | stationary (random) | (129, 221) |
| 20 | SST | 20 | stationary (random) | (36, 43) |
| 21 | SST | 21 | stationary (random) | (74, 141) |
| 22 | SST | 22 | stationary (random) | (106, 201) |
| 23 | SST | 23 | stationary (random) | (27, 94) |
| 24 | SST | 24 | stationary (random) | (63, 174) |
| 25 | SST | 25 | stationary (random) | (49, 148) |
| 26 | SST | 26 | stationary (random) | (27, 290) |
| 27 | SST | 27 | stationary (random) | (147, 348) |
| 28 | SST | 28 | stationary (random) | (122, 310) |
| 29 | SST | 29 | stationary (random) | (85, 298) |
| 30 | SST | 30 | stationary (random) | (170, 358) |
| 31 | SST | 31 | stationary (random) | (151, 183) |
| 32 | SST | 32 | stationary (random) | (177, 220) |
| 33 | SST | 33 | stationary (random) | (42, 305) |
| 34 | SST | 34 | stationary (random) | (45, 17) |
| 35 | SST | 35 | stationary (random) | (31, 125) |
| 36 | SST | 36 | stationary (random) | (153, 333) |
| 37 | SST | 37 | stationary (random) | (29, 343) |
| 38 | SST | 38 | stationary (random) | (38, 190) |
| 39 | SST | 39 | stationary (random) | (158, 228) |
| 40 | SST | 40 | stationary (random) | (101, 161) |
| 41 | SST | 41 | stationary (random) | (105, 324) |
| 42 | SST | 42 | stationary (random) | (104, 330) |
| 43 | SST | 43 | stationary (random) | (78, 303) |
| 44 | SST | 44 | stationary (random) | (141, 133) |
| 45 | SST | 45 | stationary (random) | (8, 194) |
| 46 | SST | 46 | stationary (random) | (167, 103) |
| 47 | SST | 47 | stationary (random) | (162, 203) |
| 48 | SST | 48 | stationary (random) | (17, 296) |
| 49 | SST | 49 | stationary (random) | (120, 97) |
manager.sensor_measurements_df
| SST-0 | SST-1 | SST-2 | SST-3 | SST-4 | SST-5 | SST-6 | SST-7 | SST-8 | SST-9 | ... | SST-40 | SST-41 | SST-42 | SST-43 | SST-44 | SST-45 | SST-46 | SST-47 | SST-48 | SST-49 | |
|---|---|---|---|---|---|---|---|---|---|---|---|---|---|---|---|---|---|---|---|---|---|
| 0 | 1.22 | -0.0 | -0.0 | 0.0 | 14.82 | 0.79 | 0.83 | 26.439999 | 8.83 | 11.40 | ... | 29.269999 | 26.419999 | 25.579999 | 26.929999 | 7.14 | -1.8 | -0.0 | -0.88 | -1.68 | 20.41 |
| 1 | 1.28 | -0.0 | -0.0 | 0.0 | 14.90 | 0.90 | 1.05 | 26.589999 | 9.26 | 11.39 | ... | 30.089999 | 27.079999 | 26.239999 | 26.079999 | 7.89 | -1.8 | -0.0 | -0.73 | -1.74 | 20.00 |
| 2 | 1.11 | -0.0 | -0.0 | 0.0 | 14.90 | 1.22 | 1.64 | 26.399999 | 8.75 | 11.78 | ... | 30.519999 | 27.389999 | 26.299999 | 26.489999 | 7.59 | -1.8 | -0.0 | -0.77 | -1.79 | 20.18 |
| 3 | 1.32 | -0.0 | -0.0 | 0.0 | 15.20 | 0.95 | 1.53 | 26.189999 | 9.09 | 11.03 | ... | 29.819999 | 27.489999 | 26.179999 | 26.089999 | 8.18 | -1.8 | -0.0 | -0.64 | -1.80 | 19.73 |
| 4 | 1.72 | -0.0 | -0.0 | 0.0 | 15.05 | 1.01 | 1.64 | 26.619999 | 9.37 | 11.70 | ... | 28.939999 | 27.929999 | 26.659999 | 26.079999 | 8.01 | -1.8 | -0.0 | -0.56 | -1.80 | 19.36 |
| ... | ... | ... | ... | ... | ... | ... | ... | ... | ... | ... | ... | ... | ... | ... | ... | ... | ... | ... | ... | ... | ... |
| 1395 | -1.25 | 0.0 | -0.0 | 0.0 | 10.44 | -0.67 | -1.44 | 25.579999 | 5.84 | 10.01 | ... | 28.059999 | 26.109999 | 25.129999 | 29.809999 | 5.47 | -1.8 | -0.0 | -1.80 | 4.37 | 17.32 |
| 1396 | -1.08 | 0.0 | -0.0 | 0.0 | 10.54 | -0.75 | -1.41 | 25.819999 | 6.35 | 10.29 | ... | 28.109999 | 26.059999 | 25.279999 | 29.479999 | 5.71 | -1.8 | -0.0 | -1.80 | 3.74 | 17.56 |
| 1397 | -1.13 | -0.0 | -0.0 | 0.0 | 10.83 | -0.52 | -1.18 | 27.139999 | 6.62 | 10.20 | ... | 28.419999 | 26.209999 | 25.359999 | 29.119999 | 5.80 | -1.8 | -0.0 | -1.80 | 2.18 | 17.42 |
| 1398 | -1.14 | -0.0 | -0.0 | 0.0 | 11.06 | -0.48 | -1.08 | 26.779999 | 6.64 | 9.91 | ... | 28.739999 | 26.179999 | 25.219999 | 29.809999 | 6.25 | -1.8 | -0.0 | -1.79 | 1.45 | 17.48 |
| 1399 | -1.18 | -0.0 | -0.0 | 0.0 | 11.10 | -0.38 | -0.91 | 25.899999 | 7.07 | 9.97 | ... | 28.739999 | 26.669999 | 25.589999 | 29.379999 | 6.10 | -1.8 | -0.0 | -1.80 | 0.60 | 17.84 |
1400 rows × 50 columns
Get train, validation, and test set#
train_dataset, val_dataset, test_dataset= manager.prepare()
Initialize a latent forecaster#
latent_forecaster = SINDy_Forecaster(poly_order=1, include_sine=True, dt=1/5)
Initialize SHRED#
shred = SHRED(sequence_model="GRU", decoder_model="MLP", latent_forecaster=latent_forecaster)
Fit SHRED#
val_errors = shred.fit(train_dataset=train_dataset, val_dataset=val_dataset, num_epochs=10, sindy_thres_epoch=20, sindy_regularization=1)
print('val_errors:', val_errors)
Fitting SindySHRED...
Epoch 1: Average training loss = 0.101506
Validation MSE (epoch 1): 0.023886
Epoch 2: Average training loss = 0.034503
Validation MSE (epoch 2): 0.011958
Epoch 3: Average training loss = 0.022806
Validation MSE (epoch 3): 0.011134
Epoch 4: Average training loss = 0.019222
Validation MSE (epoch 4): 0.010869
Epoch 5: Average training loss = 0.018918
Validation MSE (epoch 5): 0.010452
Epoch 6: Average training loss = 0.018897
Validation MSE (epoch 6): 0.010755
Epoch 7: Average training loss = 0.017981
Validation MSE (epoch 7): 0.010640
Epoch 8: Average training loss = 0.017609
Validation MSE (epoch 8): 0.010412
Epoch 9: Average training loss = 0.017515
Validation MSE (epoch 9): 0.010343
Epoch 10: Average training loss = 0.016812
Validation MSE (epoch 10): 0.010109
val_errors: [0.023886   0.01195758 0.01113354 0.01086859 0.01045155 0.01075485
 0.01064039 0.01041236 0.01034283 0.01010927]
Evaluate SHRED#
train_mse = shred.evaluate(dataset=train_dataset)
val_mse = shred.evaluate(dataset=val_dataset)
test_mse = shred.evaluate(dataset=test_dataset)
print(f"Train MSE: {train_mse:.3f}")
print(f"Val   MSE: {val_mse:.3f}")
print(f"Test  MSE: {test_mse:.3f}")
Train MSE: 0.009
Val   MSE: 0.010
Test  MSE: 0.012
SINDy Discovered Latent Dynamics#
print(shred.latent_forecaster)
(x0)' = -0.033 1 + 0.326 x0 + -0.008 x1 + 0.334 x2
(x1)' = -0.032 1 + 0.171 x0 + 0.009 x1 + 0.126 x2
(x2)' = 0.071 1 + -0.436 x0 + -0.023 x1 + -0.348 x2
Initialize SHRED Engine for Downstream Tasks#
engine = SHREDEngine(manager, shred)
Sensor Measurements to Latent Space#
test_latent_from_sensors = engine.sensor_to_latent(manager.test_sensor_measurements)
Forecast Latent Space (No Sensor Measurements)#
val_latents = engine.sensor_to_latent(manager.val_sensor_measurements)
init_latents = val_latents[-1] # seed forecaster with final latent space from val
h = len(manager.test_sensor_measurements)
test_latent_from_forecaster = engine.forecast_latent(h=h, init_latents=init_latents)
Decode Latent Space to Full-State Space#
test_prediction = engine.decode(test_latent_from_sensors) # latent space generated from sensor data
test_forecast = engine.decode(test_latent_from_forecaster) # latent space generated from latent forecasted (no sensor data)
Compare final frame in prediction and forecast to ground truth:
truth      = sst_data[-1]
prediction = test_prediction['SST'][-1]
forecast   = test_forecast['SST'][-1]

data   = [truth, prediction, forecast]
titles = ["Test Truth Ground Truth", "Test Prediction", "Test Forecast"]

vmin, vmax = np.min([d.min() for d in data]), np.max([d.max() for d in data])

fig, axes = plt.subplots(1, 3, figsize=(20, 4), constrained_layout=True)

for ax, d, title in zip(axes, data, titles):
    im = ax.imshow(d, vmin=vmin, vmax=vmax)
    ax.set(title=title)
    ax.axis("off")

fig.colorbar(im, ax=axes, label="Value", shrink=0.8)
<matplotlib.colorbar.Colorbar at 0x16780be13a0>

Evaluate MSE on Ground Truth Data#
# Train
t_train = len(manager.train_sensor_measurements)
train_Y = {'SST': sst_data[0:t_train]}
train_error = engine.evaluate(manager.train_sensor_measurements, train_Y)

# Val
t_val = len(manager.val_sensor_measurements)
val_Y = {'SST': sst_data[t_train:t_train+t_val]}
val_error = engine.evaluate(manager.val_sensor_measurements, val_Y)

# Test
t_test = len(manager.test_sensor_measurements)
test_Y = {'SST': sst_data[-t_test:]}
test_error = engine.evaluate(manager.test_sensor_measurements, test_Y)

print('---------- TRAIN ----------')
print(train_error)
print('\n---------- VAL   ----------')
print(val_error)
print('\n---------- TEST  ----------')
print(test_error)
---------- TRAIN ----------
              MSE      RMSE       MAE        R2
dataset
SST      0.536186  0.732247  0.402963  0.432365

---------- VAL   ----------
              MSE      RMSE       MAE        R2
dataset
SST      0.571259  0.755817  0.410853 -0.327502

---------- TEST  ----------
             MSE      RMSE       MAE        R2
dataset
SST      0.77704  0.881499  0.479537 -0.823736